View TV Observations

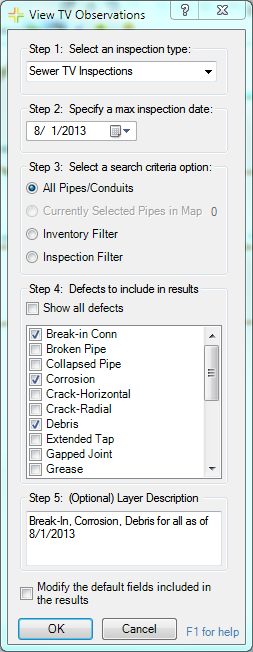
TV Observation information can be displayed in ArcMap using the View TV Observations tool. This tool creates and displays a shapefile of TV Observation points that display the type, severity and location of the observation. Each observation also has a hyperlink to related images. The hyperlinked information can be access with the ESRI hyperlink tool.

View TV Observations


Step 1: Select an inspection type

Select which module the inspection observations are stored in. They can either choose Sewer or Storm, TV or PACP inspections.

Step 2: Select a max inspection date

This tool displays the observations for the most recent inspections for each pipe based on the date. Select a max date to limit the date range of the inspection shown. For example if a user selects 9/24/2010 the tool will only display observations for inspections that occurred before 9/24/2010.

Step 3: Select a search criteria option

This allows users to limit the number of pipes the tool is run against. The tool can be run against:

  • All pipes - All pipes of the type selected in Step 1.
  • Currently Selected - Those currently selected in the map of the type selected in Step 1.
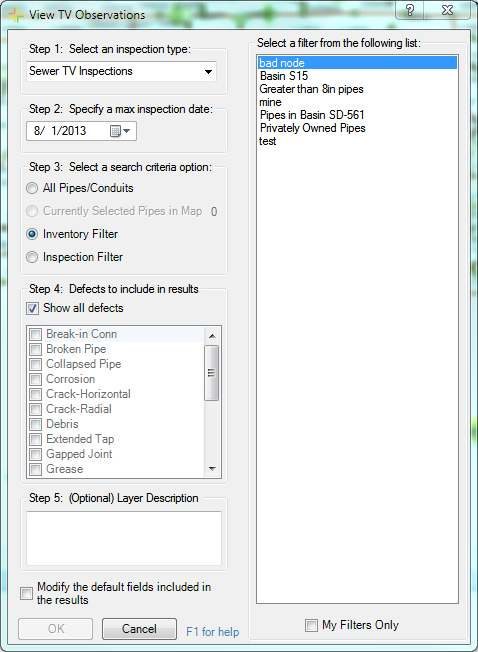
  • Inventory filters - Saved in the Sewer Pipe and Storm Conduit modules.
  • Inspection Filters - Saved in the Sewer TV/PACP Inspection modules or Storm Conduit/PACP inspection modules.

Step 4: Defects to include in results

Controls which defects will be shown in the results. Users can display everything or can un-check the Show all defects box and then select which classes of defect to show.

Step 5: Layer Description

Enter an optional Layer description to appear in the Description field on the a layer Properties > General tab.

Modify the default fields included in the results

Check this box for a pop-out that allows users to change the fields that will be included in the output layer's attribute table.

OK

Run the tool with the selected settings

Cancel

Closes the tool


How To View TV Observations

  1. Click the View TV Observations tool in the Lucity GIS toolbar. The following dialog will appear:

    View TV Observations

  2. Select an Inspection type.
  3. Set a Max inspection date.
  4. Select a Search criteria option.
  5. Decide where to show All defects or only some.
  6. Make other optional changes to the description or default feilds.
  7. Click OK to proceed. A processing status bar will appear in the lower left-hand corner of the screen.
  8. When processing is complete the temporary feature class will be added to the map. Observations are displayed in the map using a symbol placed along the pipe. The color of the symbol represents the type of defect; the size of the symbol corresponds to the severity or rating of the defect. A legend defining these symbols appears in the Table of Contents.
  9. If any of the defects have associated images/documents the ESRI hyperlink tool ESRI Hyperlink will become enabled. Use this tool to click on a defect location and the associated image/document will open directly from ArcMap.

    TV Ob Results

    Note: There is a field in the temporary feature class that indicates if there are any associated documents.

See Also

Analyst Tools

Lucity Module Tool

Filter Viewer

Subset Manager

Work Frequency

Create Lucity Work Layers

Work Request Location

Work Order Locations

Master Project Locations

PM Work Locations

Lucity Views

Profile Tool

Trace Solver

Update Sign Regulations

Customer Search

Find Feature

Lucity Field Links