Work Frequency

The View Work Frequency tool allows users to view how often work happens in an area. This tool is effective for any work order that has an address, an X and Y Coordinate (Location tab in Work Orders), or assets assigned to the work order in the Assets tab.

Enter Work


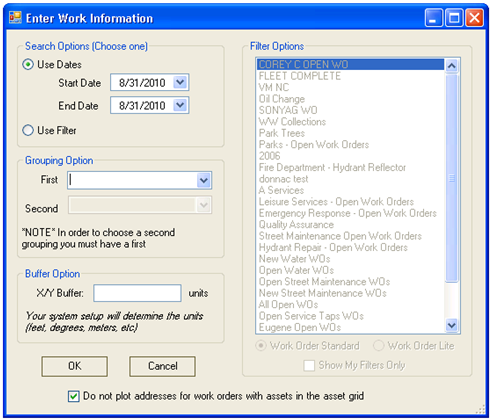
Search Options

Allows the user to select a set of work orders to display based on the a date range, or a saved filter.

Filter Options

This is enabled if users select Use Filter under the Search Options. It allows them to select a filter from the Work Order Standard or Work Order Lite modules. They can limit the list to only their filters.

Grouping Option

This allows users to group the results based on the values of one field. For example they can group the work orders by task. If there were five work orders on one location, it might show 3 different points because those five work orders were for three different tasks

X/Y Buffer

This allows users to enter a number of map units to buffer. If multiple work locations are within the entered distance of each other the tool would only display one point, with a higher frequency, for all those work orders, instead of individual points. The unit of measure is based on whatever the .mxd uses for map units.

Do not plot addresses for ...

Checking this box controls how a work order is plotted. If a work order has addresses and assets it will automatically plot both the address and asset point in the map. When this box is checked it will only plot the asset points, when they are present.



How To Plot Work Frequency

  1. To use this command, click on the View Work Frequency tool Work Frequency.

    frequency message

  2. The following dialog will appear:

    Enter Work

  3. Select either a date range or saved filter:
  4. The First and Second Grouping fields are optional.
  5. The X/Y Buffer is also optional.
  6. By default the Do not plot addresses for work orders with assets in the asset grid is checked.
  7. Click OK and the system will display the work order frequency that meets the selected criteria. While the system is processing, there will be a progress bar in the lower left-hand corner of the map.
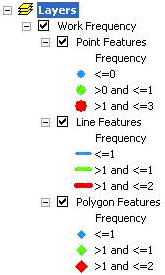
  8. Once the processing is finished, a grouped layer will be added to ArcMap containing three layers. The table of contents will show work order frequency for point, line, and polygon features. The symbology for these layers has graduated sizing and color based on frequency. To change the way the frequency is displayed, right-click on the layer and go to the symbology tab.

    frequency layers

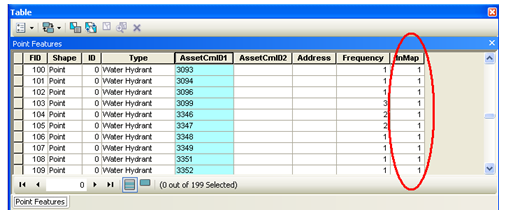
  9. In some cases, the tool may have been unable to map the location of a work order. Look in the work frequency layer's attribute table to determine whether a feature was found in the map by viewing the InMap field. A value of 1 indicates the feature was found. A value of 0 indicates that it was unable to be located in the map.

    frequency table

See Also

Analyst Tools

Lucity Module Tool

Filter Viewer

Subset Manager

Create Lucity Work Layers

Work Request Location

Work Order Locations

Master Project Locations

PM Work Locations

Lucity Views

Profile Tool

View TV Observations

Trace Solver

Update Sign Regulations

Customer Search

Find Feature

Lucity Field Links