View Hydrant Flow Testing Results

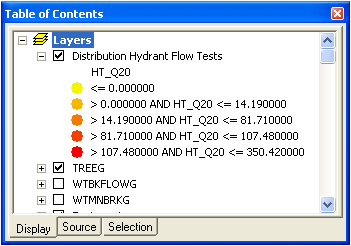
This tool will graphically display your latest hydrant flow test results in the map as another instance of your hydrant feature class. This instance will have the latest hydrant flow test information for the hydrant joined to the attribute table.  The symbology for the layer is based on the flow at 20psi (HT_Q20) of the hydrant.  Hydrants with a lower flow at 20psi will appear yellow; hydrants with a higher flow at 20psi will appear red.

Tools Drop Down

To view your hydrant flow test results in the map:

  1. In ArcMap, add your hydrant layer to the map.
  2. Click 
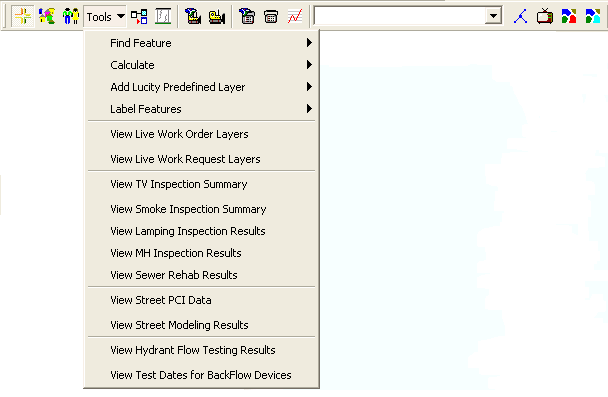
Tools > View Hydrant Flow Testing Results on the Lucity GIS toolbar.
  3. The length of time the tool takes to run depends on the number of hydrant flow tests you have in the Lucity database.  A progress bar located in the bottom left-hand corner of the ArcMap window will show the status of the tool.

    Note:  Only hydrant tests that have a test date will be displayed.

  4. When completed, another instance of your hydrant layer will be added to the map.  This instance will have an alias name of "Hydrant Flow Tests".

    Note: This tool creates a join using default settings. You can then map the instance based on any field in the module and alter the symbology as needed.

    Hydrant Layer

See Also

Tools Drop-Down Menu

Finding a Feature Based on the Feature ID

Locate Cross Street in Map

Locate Address or Cross Street in Map

Calculate the Total Length/Area

Count Selected Features

Labeling with Predefined Labels

View Live Work Order and Request Layers

View TV Inspection Summary

View Smoke Inspection Summary

View Lamping Inspection Results

View MH Inspection Results

View Sewer Rehab Results

View Street PCI Data

View Street Modeling Results

View Test Dates for Backflow Devices