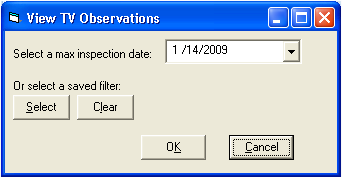
View TV Observations

TV observation information can be displayed in ArcMap using the View TV Observation tool.  This tool will create and display a shapefile of TV observation points.

  1. To use the View TV Observation tool, click the  button location on the Lucity GIS toolbar.  The following dialog will appear prompting for a date and/or a saved filter:

    View TV Obs

    OR

    Saved Filters

    TV OBS Selected Filter

  2. Click OK. A processing status bar will appear in the lower left-hand corner of your screen.  You can stop processing at any time by clicking the Cancel button on the View TV Observations dialog (pictured above).
  3. When processing is complete the shapefile will be added to the map.  Observations are displayed in the map using a symbol placed along the pipe.  The color of the symbol represents the type of defect; the size of the symbol corresponds to the severity or rating of the defect.  A legend defining these symbols appears in the Table of Contents dockable window.

    Tv Obs

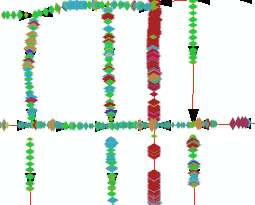
    Notes: If a pipe had been inspected on 4/8/2000, 10/31/2002, 4/31/2004, and 4/9/2004 is entered as the max inspection date, only the observations associated with the 10/31/2002 inspection would be added to the shapefile. 

See Also

GIS General Tools

Open Module Tool

Address Relationships

Customer Search Dialog

Tools Drop-Down Menu

Subset Manager

Add Sidewalk Inspection Defect Location

Show Map Interface

View Work Locations

Work Location Viewer

View Request Locations

Request Location Viewer

Lucity Trace Solver

Profile View

Assign Sewer Flow Basin

Assign Storm Flow Basin

View Work Frequency

Linking Lucity Inventory Information to a Feature Layer