 on the module toolbar. The system will then produce a graph similar to the following:
The graph function produces a schematic drawing of the pipe in the television inspection record. This drawing shows all the observations at their locations along the pipe.
To access this features, click on the module toolbar. The system will then produce a graph similar to the following:
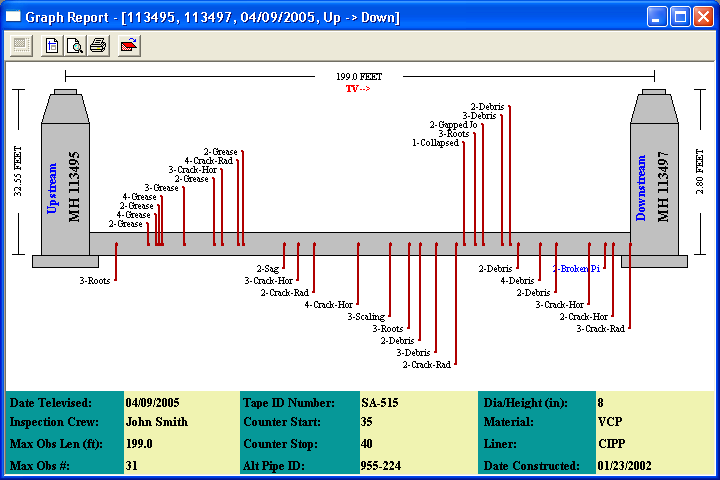
Note: Observations or defects with attached images are highlighted. Click on the highlighted observations to view each image.