
The Data Grid enables users to see information about and interact with GIS and Lucity data related to features in the map.
Opening the Data Grid
The Data Grid is displayed when either of the following map tools is used:
Tool |
Description |
Appears in |
||||
|
Displays the layers' attribute data from the GIS system. |
|||||
|
Displays the Lucity module view from the Lucity system. |
Identify pop-up, Selection Toolbar, Data Grid |
||||
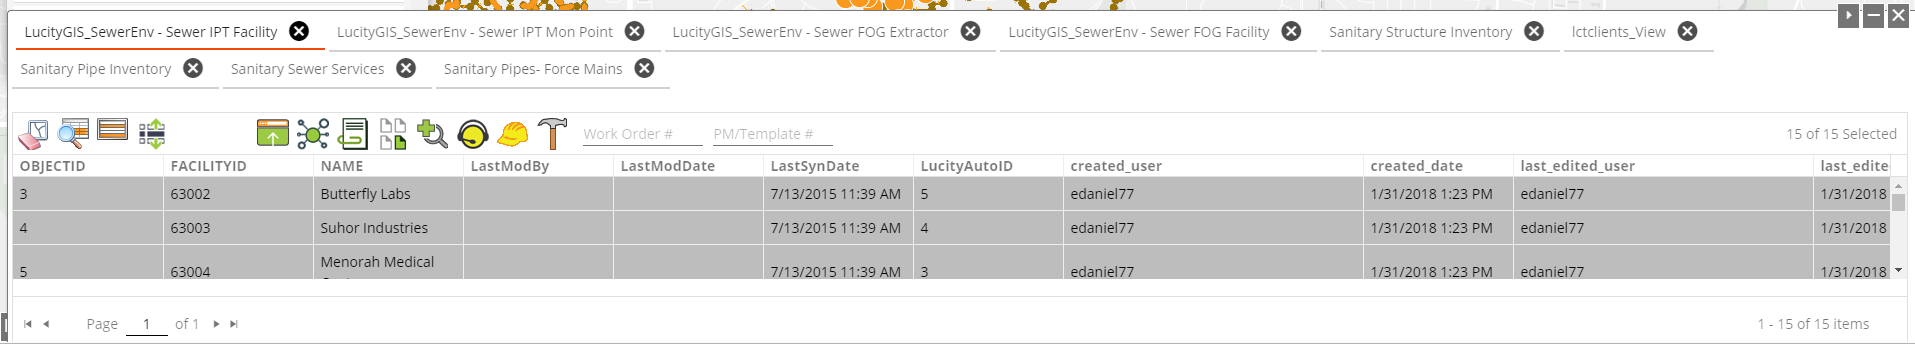
Tabs
The Data Grid displays the GIS data table and Lucity module view on separate grids. While both the table and view may show the same record, one displays the GIS record information while the other displays Lucity information. The tab indicates which data source the user is viewing. The Module View tabs (Lucity data) display the  icon.
icon.
Grid Display Controls
Above the table, on the right, are buttons that control the table's appearance:
|
Dock Right Dock Bottom |
Moves and ties the grid to the right side of the screen. Moves and ties the grid to the bottom of the screen. |
|
Collapse Expand |
Minimizes the grid, providing a larger view of the map. Maximizes the grid to display the table. |
|
Close |
Closes the grid, but does not clear the current selection. |
|
Resize Grid |
Enables the user to hover the cursor over the edge of the grid to access a resize control. Click and drag to change the grid's size. |


