
The Data Grid enables users to see information about and interact with GIS and Lucity data.
Opening the Data Grid
The grid is opened when either of the following tools are used.
Tool |
Description |
Appears in |
||||
|
Displays the layers' attribute data from the GIS System. |
|||||
|
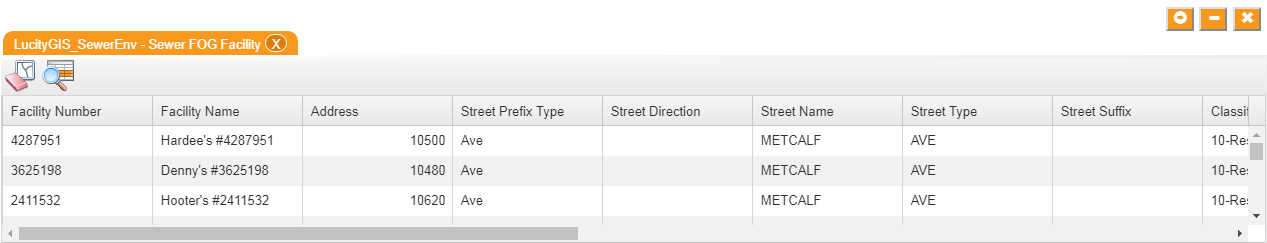
Displays the Lucity module view from the Lucity System. |
Identify pop-up, Selection Toolbar, Data Grid |
||||
Tabs
The Data Grid displays the Data Table and Module Views on separate grids. While both the Table and View may be showing the same record one is displaying the GIS records while the other is displaying the Lucity record. Each tab indicates that the what data you are looking at. The Module View tabs (Lucity data) will display the  icon.
icon.
Grid Display Controls
Above the table, on the right, are buttons that control the table's appearance:
|
Dock Right Dock Bottom |
Docks the grid to the right side of the screen. Docks the grid to the bottom of the screen. |
|
Collapse Expand |
Collapses the grid providing a larger view of the map. Expands the grid to display the table. |
|
Close |
Closes the grid, but does not clear the current selection. |
|
Resize Grid |
Hover the cursor over the edge of the grid for a resize control. Click and drag to change the grid's size. |


