
 Print
Print
|
|
|
|
|
Frames and Plugins
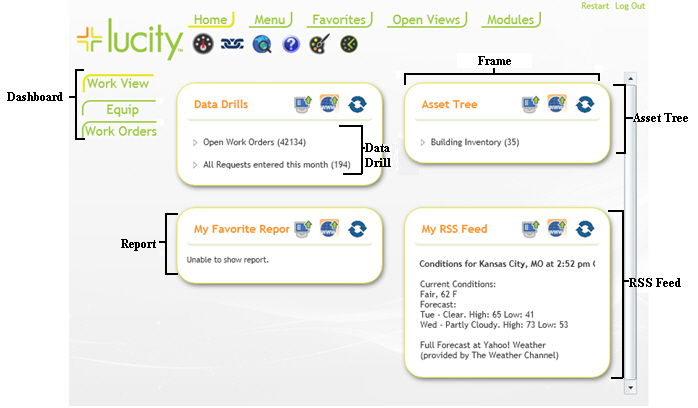
Every user can have multiple Dashboards as well as multiple frames on the Dashboard page. A frame is simply a box containing specified groups of information. Each frame will need to be given a title to be displayed at top. The frames can contain multiple drill-down levels each, as well as RSS feeds and Asset Hierarchy Trees.
- Each data drill and asset hierarchy listing is a line showing the results of filter. Beside each item title and drill-down level you will see the filter's record count displayed. The results of the filters can be viewed by clicking on the plus signs (+) beside the item and drill-down level titles.
- The filters provide access to the modules and customized web forms. The filters allow the Dashboard to be Work Order based, Service Request based, or Asset based. By clicking on a drill-down level, either a customized web form will open on screen, or the related module in the desktop application will be launched and will display the number of records matching the filter. The program opened is determined by options selected by your administrator.
- The Dashboard reports are Crystal Reports® that may have been customized by your system administrator. These can be displayed in either PDF or HTML format. Note that the Crystal Reports license only allows three simultaneous reports. If four users are running reports at the same time, the fourth user may receive a message stating that the maximum number of concurrent licenses has been reached. If you receive this message you may need to try the report again.
In This Section |
See Also |
Print
| © Lucity, Inc. All rights reserved. |
|