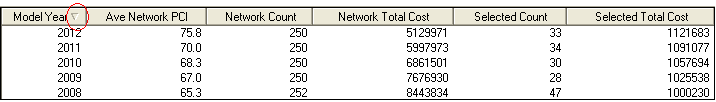
This tab contains a grid that summarizes the completed model run results. A sample of the grid appears below. You can sort records in the grid by clicking on the headings. An up or down arrow (circled in red below) will appear signifying ascending or descending order. Click the heading again to change directions.
The model run tracks summary data for each model year. The categories in this grid are defined below:
Column Name |
Contents |
Average Network PCI |
The entire system PCI over the course of the model year. |
Network Count |
The number of streets reviewed in the model run. |
Network Total Cost |
The projected cost to repair every street in the system based on each street's selected rehab technique. |
Selected Count |
The number of streets selected for rehabilitation. |
Selected Total Cost |
The actual cost of rehab for the selected streets. Note: This cost should be close to the forecasted budget amount. |
Backlog Costs |
The amount of money needed for streets in key zones or key areas where rehab was not completed. |
Note: The data in these records can also be found in the Year-End Summary Results module.