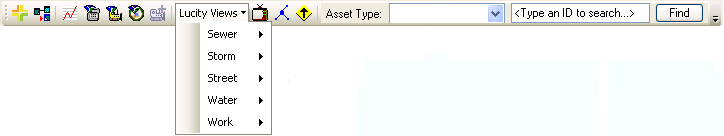
How to use the Lucity views
The Lucity Views tools allow users to create layers that reflect Inspection, and Model data from the Lucity system. These are static layers that display the data present in Lucity at the time the layer was created.
Note: In order to generate the view, the feature class the view is based on must be represented in the map. For example, Sewer Pipe assets must be added to the map for the PACP Inspection Summary view to work.
View Descriptions
Sewer
View Manhole Inspection Results |
Graphically displays the latest Manhole Inspection information as another instance of the Sewer Structure feature class. This instance displays the latest Structure Inspection information for each Structure joined to the Attribute table. The symbology for the layer is based on the Total Structural Number (MH_SUM_STR) of the Inspection. Manholes with a lower structural number appear yellow; manholes with a higher structural number appear red. |
View TV Inspection Summary |
Graphically displays the latest TV Inspection information as another instance of the Sewer Pipe feature class. This instance displays the latest TV inspection information for each Pipe joined to the Attribute table. The symbology for the layer is based on the Total Structural Number (TL_STR_TOT) of the Inspection. Pipes with a lower structural number appear yellow; pipes with a higher structural number appear red. |
View PACP Inspection Summary |
Graphically displays the latest PACP Inspection information as another instance of the Sewer Pipe feature class. This instance displays the latest PACP Inspection information for each Pipe joined to the Attribute table. The symbology for the layer is based on the Total Pipe Rating (PA_PRT) of the Inspection. Pipes with a lower structural number appear yellow; pipes with a higher structural number appear red. |
View Lamping Inspection Results |
Graphically displays the latest Lamping Inspection results as two additional instances of the Sewer Pipe feature class. One instance shows Lamping Inspections from the downstream structure; the other, Inspections from the upstream structure. These added layers display the latest Lamping Inspection information for each Pipe joined to the Attribute table. The symbology for the layers is based on the Total Structural Number (LP_TOT_STR) of the inspection. Pipes with a lower structural number appear yellow; pipes with a higher structural number appear red. |
View Smoke Inspection Summary |
Graphically displays the latest Smoke Test Inspection information as another instance of the Sewer Pipe feature class. This instance displays the latest Smoke Test Inspection information for each Pipe joined to the Attribute table. The symbology for the layer is based on the Result Text (SM_RSLT_TY) of the Inspection. |
View Sewer Rehab Results |
Graphically displays the Sewer Rehab results as another instance of the Sewer Pipe feature class. This instance displays the latest Pipe Analysis Details for each Pipe joined in the Attribute table. |
Storm
View Structure Inspection Results |
Graphically displays the latest Structure Inspection information as another instance of the Storm Structure feature class. This instance displays the latest Structure Inspection information for each Structure joined to the Attribute table. The symbology for the layer is based on the Total Structural Number (SI_STR_TOT) of the Inspection. Structures with a lower structural number appear yellow; structures with a higher structural number appear red. |
View TV Inspection Summary |
Graphically displays the latest TV Inspection information as another instance of the Storm Conduit feature class. This instance displays the latest TV Inspection information for each Pipe joined to the Attribute table. The symbology for the layer is based on the Total Structural Number (CI_TOTSTRC) of the Inspection. Pipes with a lower structural number will appear yellow; pipes with a higher structural number will appear red. |
View Storm Sampling Results |
Graphically displays the latest Storm Sampling results as another instance of the Storm Structure feature class. This instance displays the latest Storm Sampling information for each Structure joined to the Attribute table. The symbology for the layer is based on the Total PH Count (SS_PH_D, SS_PH_U, SS_PH_A) of the Inspection. The results appear as a group layer with three feature classes, representing samples that were performed 1) upstream from the structure, 2) downstream from the structure, and 3) at the structure. |
Street
View Street PCI Data |
Graphically displays the current PCI data as another instance of the Street Subsegment feature class. This instance displays the latest Field Inspection information for each Subsegment joined to the Attribute table. The symbology for the layer is based on the current PCI number (FD_CUR_PCI) of the Inspection. Subsegments with a lower PCI appear yellow; subsegments with a higher PCI appear red. |
|
|
Graphically displays the Modeling results based on the subsegment or supersegment results. This is generated as another instance of the Street Subsegment or Supersegment feature class. This instance displays the selected Model results for each Subsegment or Supersegment joined to the Attribute table. The symbology for this layer is based on the Rehab Text of the Model results. Also enables users to assign supersegments and rehab techniques to planning tables. |
Street Pavement Maintenance |
Graphically displays the latest Street Pavement Maintenance results as another instance of the Street Subsegment feature class. The symbology for this layer is based on the Override PCI entered when the maintenance was complete. |
Road Pavement Maintenance |
Graphically displays the latest Road Pavement Maintenance results as another instance of the Road Segment feature class. The symbology for this layer is based on the Override PCI entered when the maintenance was complete. |
Water
View Hydrant Flow Test Results |
Graphically displays the latest Hydrant Flow Test results as another instance of the Hydrant feature class. This instance displays the latest Hydrant Flow Test information for the Hydrant joined to the Attribute table. The symbology for the layer is based on the Flow at 20 psi (HT_Q20) of the hydrant. Hydrants with a lower flow at 20 psi appear yellow; hydrants with a higher flow at 20 psi appear red. |
View Test Dates for Backflow Devices |
Graphically displays the Next Backflow Device Test Dates as another instance of the Backflow Device feature class. This instance displays some Inventory data for the Backflow Device joined to the Attribute table. The symbology for the layer is based on the Next Test Date (BF_NTST_DT) of the Backflow Device. Devices with an earlier next test date appear yellow; devices with a later next test date appear red. |
View Meter Device and AMR Info |
Graphically displays the Water Meter locations with all of the fields from the Water Meter Device and AMR Reader modules. These fields display information from the Device and Reader that are attached to the Water Meter location. |
|
In This Section |