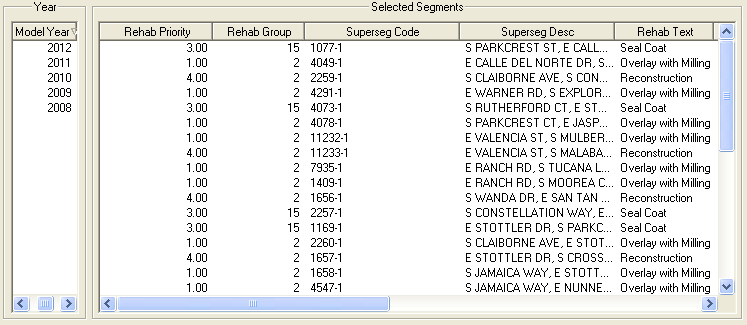
This tab contains two grids displaying model run results for all segments selected for rehabilitation. The grid on the left allows you to choose which year's model run results will be displayed in the grid to the right. The Selected Segments grid on the right displays each supersegment selected for rehabilitation along with descriptive information. This information includes the supersegment code and description, the type of rehab needed, the type of surface and road, PCI values, cost data, and the length and area of each selected segment. To sort records in the grid, click on the headings. An up or down arrow (circled in red below) will appear signifying ascending or descending order. Click the heading again to change directions.

Note: Detailed data for these listings can be found in the Segment Results module.