The View Work Request Locations tool allows users to view the locations of Requests in ArcMap. Users can view either:
static, temporary layers that display Requests filtered at the time that the tool is run; or
dynamic layers of Requests that are constantly updated.
Once the Work Request locations have been added to the map, the View Work Request Location tool enables users to view and edit Work Requests and to view a Work Request report. This tool plots any Request that has an Address, an X/Y coordinate or an assigned Asset.
Note: The Inventory feature classes do not need to be added to the map prior to using this tool.
Work Request Locations
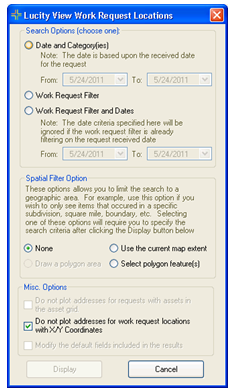
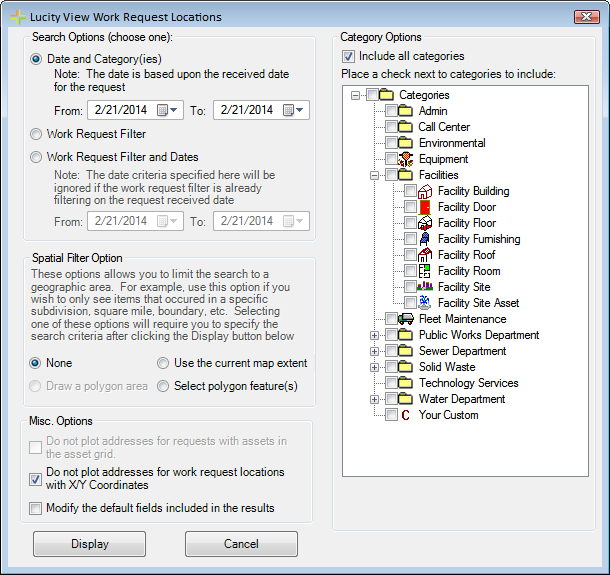
Search Option
Gives users options for identifying a set of Work Requests to display.
Date and Category(ies)
Displays a set of Requests in a user defined date range and selected categories. These are based on the Request's received date and Category.
Work Request Filter
Displays all Requests that are part of a saved Work Request filter.
Work Request Filter and Dates
Displays all Requests that are part of a saved Work Request filter that fall into a selected date range.
Category Options
Limits results to selected Categories. This option appears when theDate and Category(ies) option is selected above.
Spatial Filter Options
Enables users to filter results to a selected area.
Use the current map extent
Displays only those Requests that fall within the area of the map that is currently visible.
Select polygon feature(s)
Displays only those Requests that fall within an area of the map the user selected with the Polygon tool.
Misc Options
Let users control the results in other ways.
Do not plot addresses for requests with assets...
This option is currently disabled.
Do not plot addresses for work request locations with X/Y Coordinates
Prevents the system from plotting the location of a single Request twice when the Request includes both an Address and an X/Y coordinate. If the option is disabled, the system will plot both locations.
Modify the default fields ...
When the tool plots the request locations it displays associated request information in the Attribute table. Check this box to open a new section of the tool. In this section of the tool you can modify which data from each request record is displayed in the Attribute table.
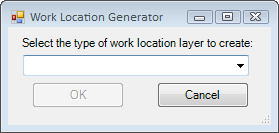
Click the button in the toolbar. The following pop-up appears:
OR
Click on the View Work Request Locations tool . The following pop-up appears:
Note: This option will not work if a Request or Request Live layer already appears in the map.
Select Requests.
Click OK. The associated tool appears, which allows the user to filter the Requests.
Choose a search option:
Date and Category(ies)- Displays Requests with one of the selected CategoriesAND that have a Start Date that falls within the selected dates.
Work Request Filter- Displays all Requests that meet the specified filter's criteria.
Work Request Filter and Dates- Displays Requests that meet the criteria specified in the filter and whose Request Start Date that falls within the selected dates.
Depending on the search option chosen, the form expands to display either a list of Categories or a list of filters. Select the desired Category or filter.
To view Work Requests from just one category, expand the Category tree at right and select a Category. The system will return Requests assigned to that specific Category, not Requests assigned to the categories beneath that Category.
To show Requests from all categories, check the All Categories checkbox.
Note: If no Category is selected, the system automatically queries all categories.
Choose a Spatial Filter Option. These options enable users to view Requests in an area of the map that they specify.
None - Displays Requests identified by the previously selected Category/Dates/Filters.
Use the Current Map extent - Displays Requests for the area that is currently visible in ArcMap.
Select Polygon Feature(s) - Displays Requests that fall within an area the user selects with the Polygon tool.
Note: The tool actually plots all Requests and then clips the feature class down to the area specified in the spatial filter.
By default, the Do not plot addresses for work request locations with X/Y Coordinates is checked. If the user chooses to disable the option, the results will contain points for both the request's Address and its X/Y coordinate, if that information is available.
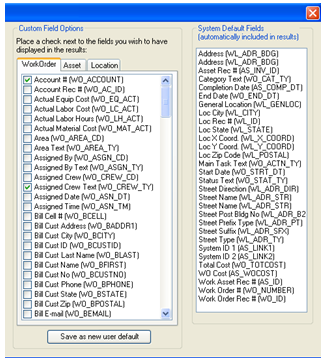
Enable the Modify the default fields included in the results option. The tool includes certain fields in the results by default. Enabling this option allows the user to decide which fields appear in the results. When checked, the form expands to expose the following items:
Check the box next to the fields you want to add to the results.
Fields displayed by default are shown in the list to the far right. Users cannot modify this list, because these fields are required for the tool to function properly.
Users can save their custom field choices by clicking the Save as new user default button. This setting is saved to the database, and these fields will automatically be checked the next time the user runs the tool.
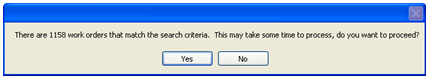
When ready to process, click Display. If the system has a significant number of Work Orders to process, a dialog box similar to the one below appears:
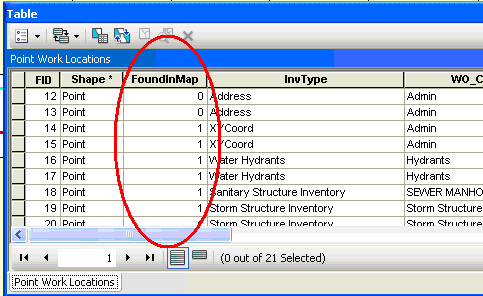
The tool attempts to map all Work Request Locations for all Work Requests that meet the selected criteria. Any features that the system was unable to represent spatially are still added to the layer; however, they will have a FoundInMap value of "0"in the Attribute table for the feature class.
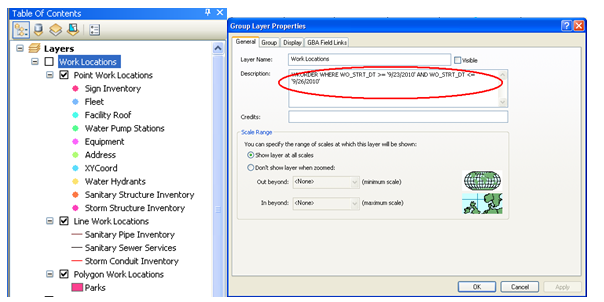
Once the processing is finished, a temporary feature class is added to ArcMap. It contains three layers: point, line, and polygon. To change the way the features are displayed, right-click on the layer and select Properties > Symbology tab.
The search criteria used for the Work Requests is listed in the description for the group layer. To access this information, right-click on the grouped layer and select Properties. A screen similar to the following appears:
After Work Requests have been plotted in the map, click on the View Request Locations tool .
While the tool is enabled, right-click on a Work Request Location. A menu appears with three options:
View Work Request(s)
Edit Work Request(s)
View Work Request Report
Select the desired option.
View Work Requests: Opens the selected Work Request(s) in Lucity Desktop's View mode.
Edit Work Request(s): Opens the selected Work Request(s) in an editable grid within ArcMap. By default, all required fields are added to the grid, including those required by the Desktop application and those set as required by users.
View Work Request Report: Opens the Work Request Report that Lucity provides a default report. The tool takes a snapshot of the current ArcMap display and saves it as a .jpg file; the Work Request Report then uses this file.
A submenu appears that lists the Work Requests located within the search tolerance of the mouse-click. Select the Work Request on which you'd like to perform the function.
Note: To perform an action on multiple Work Requests, use the ESRI selection tool to select the Work Requests before clicking the View Work Locations tool. Then, right-click. The For all selected Work Requests option appears in the submenu.
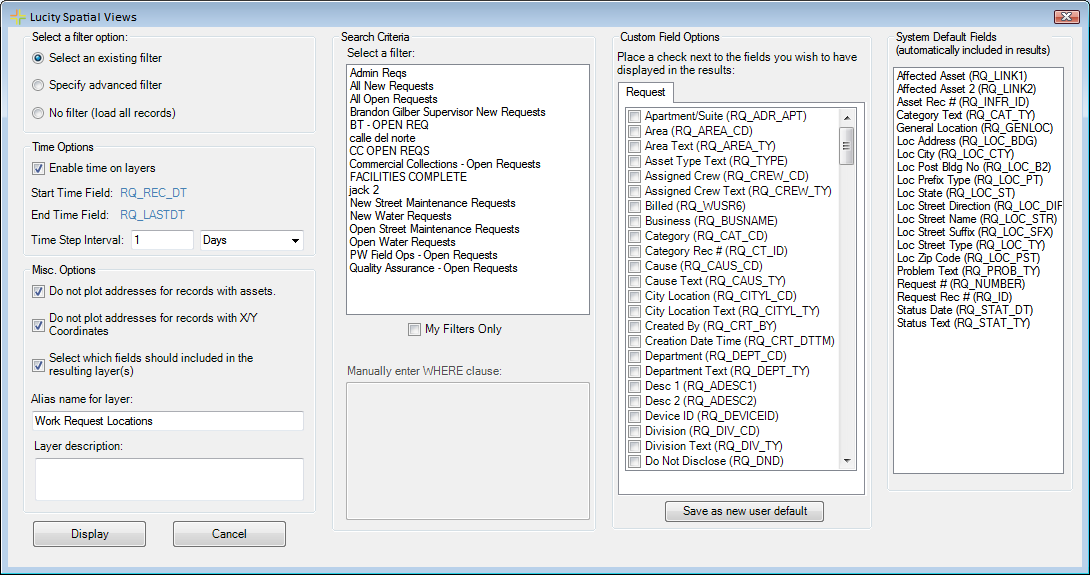
Work Request Locations Live
Select a filter option
Provides several ways for users to select a set of work requests to display.
Select an existing filter
Enables users to select a filter created previously in the Requests module.
Specify advanced filter
Allows users to manually enter a filter using SQL.
No filter (load all records)
Displays all requests that have spatial information.
Search Criteria
Enable users to select or add a filter, depending on their previous selection.
Select a Filter
Displays all filters that were previously created and saved in the Requests module. Check the My Filters Only box to show only the filters created by the current user.
Manually enter WHERE clause
Enables the user to type in a filter for the Request module using SQL. (The statement should start with WHERE.)
Time Options
Allow users to incorporate the ESRI time functions available within ArcMap within the Lucity Webmap layer.
Enable Time on Layers
Enables the ESRI time function for Request layers.
Start Time Field
End Time Field
Indicates the preconfigured table fields that the time functions will use.
Time Step Interval
Enables the user to designate the number of days/weeks/months into which the time functions should group the Requests.
Note: This value can be changed in the layer properties after the layer is created.
Misc Options
Provide other ways to control the results.
Do not plot addresses for requests with assets...
Prevents the system from plotting the Address of the Request if there is an associated Asset. When the option is disabled, the system plots both the Address and the Asset.
Do not plot addresses for work request locations with X/Y Coordinates
Prevents the system from plotting the Address of the Request if an X/Y coordinate is set. When the option is disabled, the system plots both the Address and the X/Y coordinate.
Select which fields should be included in the resulting layer(s)
When the tool plots the request locations it displays associated request information in the Attribute table. Check this box to open a new section of the tool. In this section of the tool you can modify which data from each request record is displayed in the Attribute table.
Alias name for layer
Indicates the name for the layer that will be displayed in the map's table of contents.
Layer description
Indicates the description that will appear in the layer's properties.
Click the button in the toolbar. The following pop-up appears:
OR
Click on the View Work Request Locations tool . The following pop-up appears:
Note: This option will not work if a Request or Request Live layer already appears in the map.
Select Requests.
Click OK. The associated tool appears to enable users to filter down which requests to display.
Choose a filtering option:
Select an existing filter - Lets the user select a filter that was created and saved in the Request module.
Specify advanced filter - Lets the user write a filter using SQL.
No filter (load all records) - Loads all Request records that contain spatial data.
Depending on the option the user chooses, the user should then:
Select a filter from the list of filters. (To display only your filters, check the My Filters Only box.)
Write a filter in the Manually enter WHERE clause box. (Start the SQL statement with WHERE...)
Enable time functions on the layers (if desired) and enter the Time Step Interval.
The following options are enabled by default:
Do not plot addresses for records with assets - When a Request contains an Asset and the Address, the tool plots only the asset. When disabled, the tool plots both.
Do not plot addresses for records with X/Y Coordinates - When a Request contains an Address and X/Y coordinates, the tool plots only the X/Y coordinates. When disabled, the tool plots both.
Certain fields are added to the results by default. Check the Select which fields should included in the resulting layer(s) box to designate which fields will be included in the results. The form expands to expose the following items:
Check the fields you wish to add to the results.
Fields displayed by default are shown in the list to the far right. Users cannot modify this list, because these fields are required for the tool to function properly.
Users can save their custom field choices by clicking the Save as new user default button. This setting is saved to the database, and these fields will automatically be checked the next time the user runs the tool.
After Work Requests have been plotted in the map, click on the View Request Locations tool .
While the tool is enabled, right-click on a Work Request Location. A menu appears with three options:
View Work Request(s)
Edit Work Request(s)
View Work Request Report
Select the desired option.
View Work Requests: Opens the selected Work Request(s) in Lucity Desktop's View mode.
Edit Work Request(s): Opens the selected Work Request(s) in an editable grid within ArcMap. By default, all required fields are added to the grid, including those required by the Desktop application and those set as required by users.
View Work Request Report: Opens the Work Request Report that Lucity provides a default report. The tool takes a snapshot of the current ArcMap display and saves it as a .jpg file; the Work Request Report then uses this file.
A submenu appears that lists the Work Requests located within the search tolerance of the mouse-click. Select the Work Request on which you'd like to perform the function.
Note: To perform an action on multiple Work Requests, use the ESRI selection tool to select the Work Requests before clicking the View Work Locations tool. Then, right-click. The For all selected Work Requests option appears in the submenu.
 How to use the Work Request Location tool
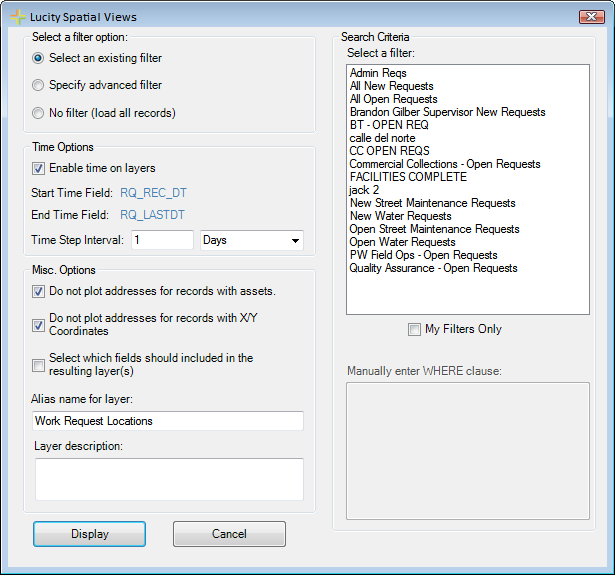
 . The following pop-up appears: