Module Spatial Data Tool
The Module Spatial Data tool enables users to display Lucity Work data and some Inspection data in the map. These data layers represent a live, spatial view of the information in the Lucity database.
Data from the following modules can be viewed in the map using the Module Spatial Data tool:
Sewer Pipe TV Inspections Pipe CCTV Assessment Pipe Smoke Tests Building Inspections Overflows Storm Conduit TV Inspections Conduit CCTV Assessment Street Routes Sidewalk Inspections Water Flushing Routes Mainbreaks Raw Mainbreaks Recycled Mainbreaks Work Work Requests Work Orders Work Permits PM/Templates Master Projects Projects
Prerequisites
To use the Module Spatial Data tool, an agency must be running the Lucity Spatial Updater .
More information about the Lucity Spatial Updater
Topics
Tool Components Symbology After adding the Lucity Spatial information to the map, users can interact with the layers using several system tools.
Map Layers
New layers are added to the map for different types of locations: One for point locations, one for lines , and one for polygons . In the Table of Contents, users can hide layers, open the data table, or remove the layer completely.
Data Table
If you go to the data table click the arrow next to the layer you created to expand it. Click the
Open Module View
Opens the Data table and displays the Lucity Data for the currently selected records.
This gives you access to more detailed information and allows you to edit the Lucity record.
Relationships *
Displays a list of modules with records related to the selected record in the grid.
Documents
Enables users to view documents attached to a highlighted feature and/or attach new documents.
Layers assigned to GIS Views Common Tasks
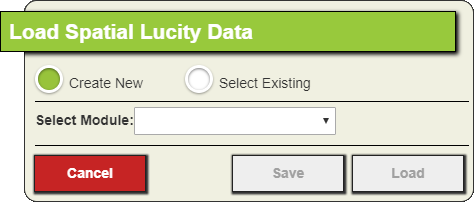
Click the
Select Create New . Use the Select Module drop down to select which module this layer is for. The dialog will expand:
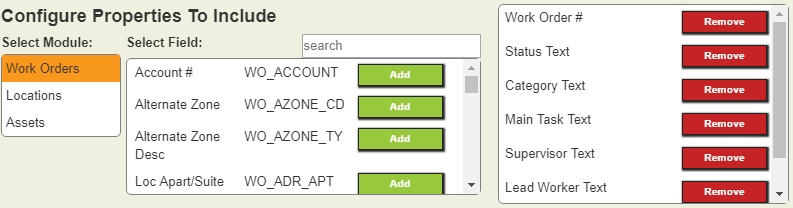
Filter ResultsClick the Acquire button to select a filter. More information about acquiring filters . If you are only interested in data that is in the area the map is currently displaying check the Limit results to current map extent box. Configure desired fieldsIn the Fields To Include in Results section, select any additional fields that should show up in the results.
Use Select Module to identify which part of the record the field comes from. Use Select Field to pick one or more fields to add to the results. Click the Add button next to each desired field. Configure layer propertiesEnter the Layer Title that should be displayed in the Table of contents. For simple symbology select a Symbol Color . For more complex symbology mark the Color code based on field box.Select a Field on which to base the symbology. Click on the Color Palette to select a different set of colors. If desired click to Assign Colors button to assign specific colors to specific field values. More information about symbology
If desired change the number into the Symbol Size field. If desired set the Auto Refresh Interval to make the layer automatically update with new data. If desired enter a Setup Name and Setup Description and click Save to store the configuration. You will be able to load the configuration later. Click Load . The spatial data is loaded into the map and will appear in the Table of Contents .
Click the
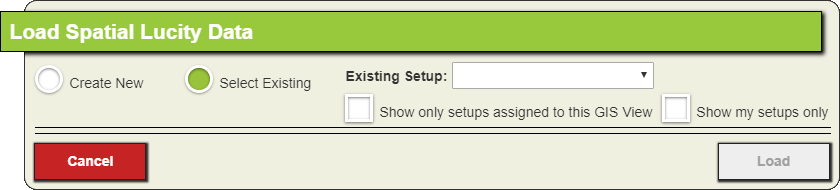
Click Select Existing . The dialog will expand.
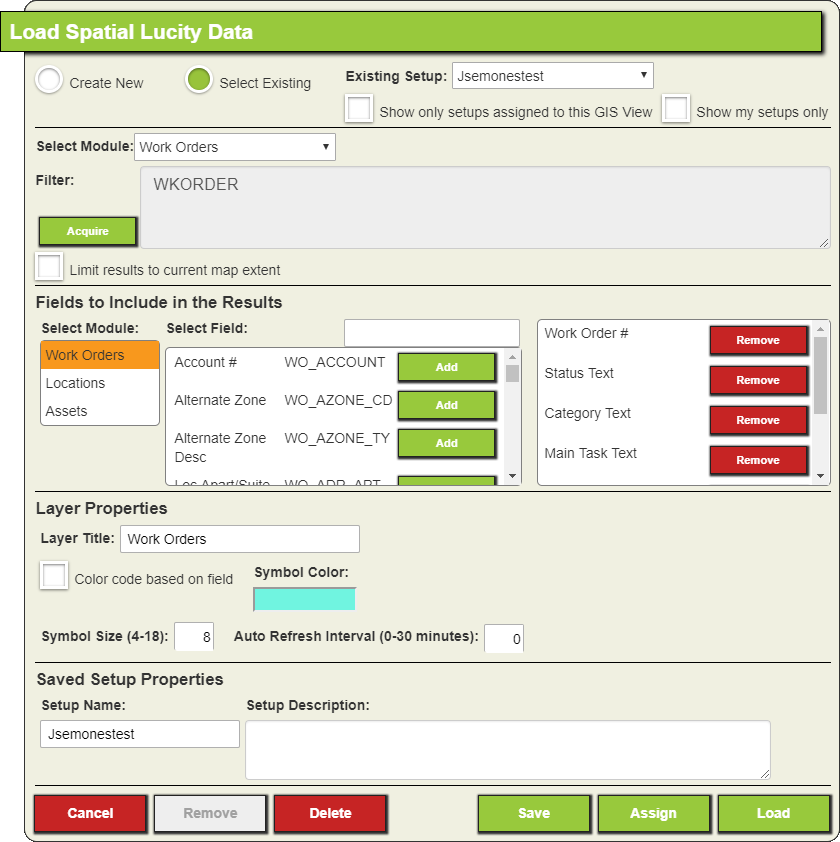
Select an Existing Setup . If needed use the Show only setups assigned to this GIS View and Show my setups only boxes to limit the number of options. A the dialog will expand and will look similar to the following:
Filter ResultsClick the Acquire button to select a filter. More information about acquiring filters . If you are only interested in data that is in the area the map is currently displaying check the Limit results to current map extent box. Configure desired fieldsIn the Fields To Include in Results section, select any additional fields that should show up in the results.
Use Select Module to identify which part of the record the field comes from. Use Select Field to pick one or more fields to add to the results. Click the Add button next to each desired field. Configure layer propertiesEnter the Layer Title that should be displayed in the Table of contents. For simple symbology select a Symbol Color . For more complex symbology mark the Color code based on field box.Select a Field on which to base the symbology. Click on the Color Palette to select a different set of colors. If desired click to Assign Colors button to assign specific colors to specific field values. More information about symbology
If desired change the number into the Symbol Size field. If desired set the Auto Refresh Interval to make the layer automatically update with new data. Click Save to update the saved configuration. You will be able to load the configuration later. Click Load . The spatial data is loaded into the map and will appear in the Table of Contents .
Click the Click Select Existing . The dialog will expand.
Select the Existing Setup that needs to be removed. If needed use the Show only setups assigned to this GIS View and Show my setups only boxes to limit the number of options. A the dialog will expand and will look similar to the following:
Click the Delete button. The dialog closes and the saved layer setup is deleted.
Open the GIS View that needs an assigned Module Spatial Layer. Click the Click Select Existing . The dialog will expand.
Select an Existing Setup . If needed use the Show only setups assigned to this GIS View and Show my setups only boxes to limit the number of options. A the dialog will expand and will look similar to the following:
Click the Assign button to add it to the current view. Click Cancel to close the dialog. The Module Spatial Layer will appear the next time the GIS View is loaded.

 Modules supported by Lucity Spatial
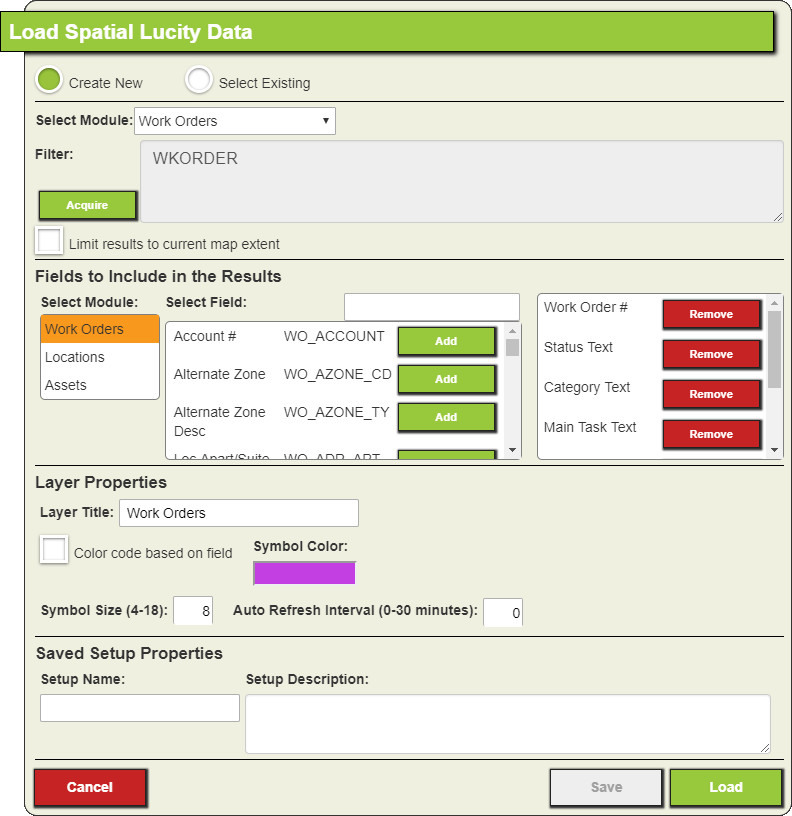
 to open the gis Data Table for the layer. Select a record in the list to display several Lucity tools.
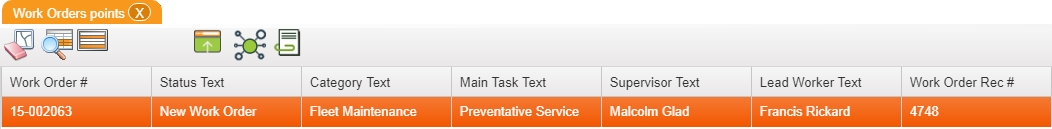
 button. The following dialog appears: