The Module Spatial Data tool enables users to display Lucity Work data and some Inspection data in the map. These data layers represent a live, spatial view of the information in the Lucity database.
To use the Module Spatial Data tool, an agency must be running the Lucity Spatial Updater. More information about the Lucity Spatial Updater
Data from the following modules can be viewed in the map using the Module Spatial Data tool:
Sewer
Pipe TV Inspections
Pipe CCTV Assessment
Pipe Smoke Tests
Building Inspections
Overflows
Storm
Conduit TV Inspections
Conduit CCTV Assessment
Street
Routes
Sidewalk Inspections
Water
Flushing Routes
Mainbreaks
Raw Mainbreaks
Recycled Mainbreaks
Work
Work Requests
Work Orders
Work Permits
PM/Templates
Master Projects
Projects
Tool Components
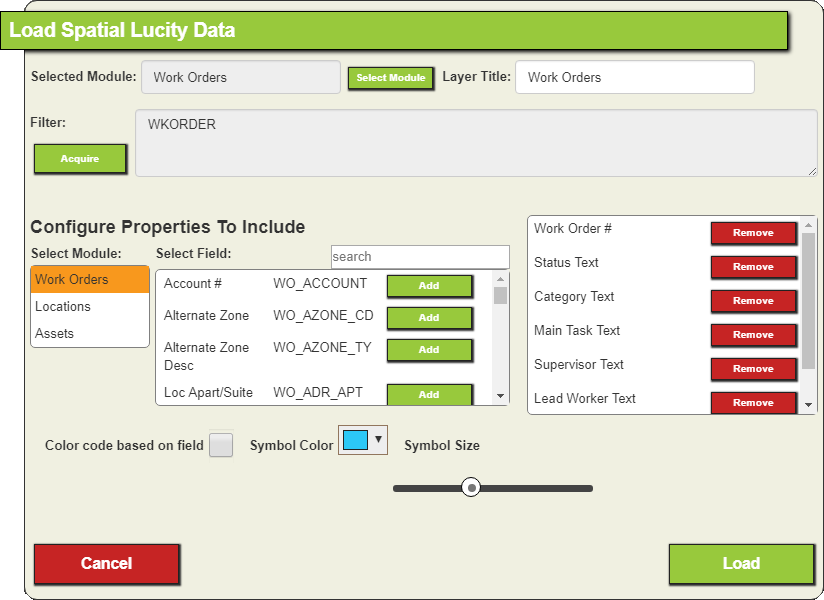
FIlter
The first section of the tool is used to select the data that will be displayed in the map.
Selected Module
Identifies the Lucity module that contains the information the user wishes to display in the map.
Select Module
Enables the user to select a module to display.
Layer Title
Indicates the name of the map layer that this tool will create. Users may edit the name generated by the system.
Filter
Enables the user to specify the set of records that the tool will display in the map.
Acquire
Enables the user to edit the Filter that the tool will use.
Limit results to current map extent
Causes the tool to only display results that would show up in the current bounds displayed in the map.
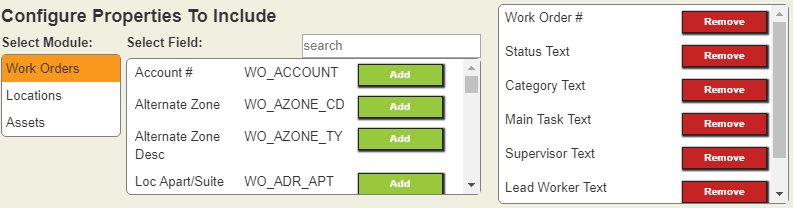
Fields
The second section of the tool is used to select which Lucity fields to include in the map layer.
Select Module
Lists the tables that are part of the Selected Module. Click on a table to see its fields.
Select Field
Lists all fields that are part of the selected table. Click a field and then click the Add button add it to the selected fields box (far right of pop-up).
Selected Fields
Indicates which fields have been selected for inclusion in the map layer. Click a field and then click Remove to exclude it from the map layer.
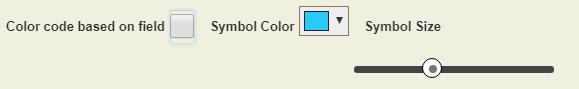
Symbols
The last section of the tool lets the user control map symbols.
Symbology Color
Identifies the color in which the map layer's symbols will appear.
Color code based on field
Field
Color Palette
Enable the user to color-code the location points in the map based on a designated field.
Check the Color code.... box. This enables the Field and Color Palette options while disabling Symbology Color.
Select a Field in the drop-down box on which to base the color coding.
Choose a Color Palette.
Symbol Size
Controls the size of the symbols that will appear in the map.
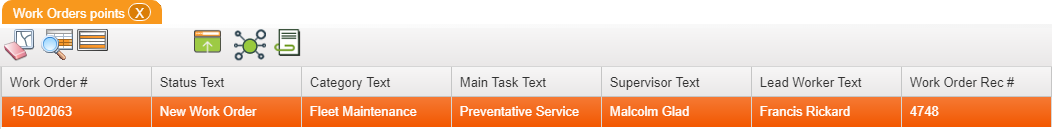
After adding the Lucity Spatial information to the map, users can interact with the points using several system tools.
Map Layers
New layers are added to the map for different types of locations: One for point locations, one for lines, and one for polygons. In the Table of Contents, users can hide layers, open the data table, or remove the layer completely.
Data Table
If you go to the data table click the arrow next to the layer you created to expand it. Click the to open the gis Data Table for the layer. Select a record in the list to display several Lucity tools.
Open Module View
Opens the Data table and displays the Lucity Data for the currently selected records.
This gives you access to more detailed information and allows you to edit the Lucity record.

 Modules supported by Lucity Spatial
 button.
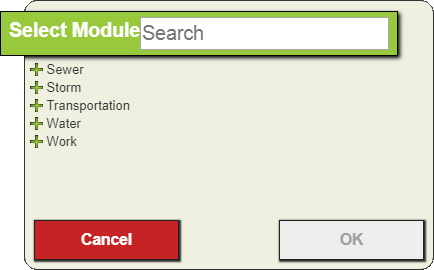
 to open the gis Data Table for the layer. Select a record in the list to display several Lucity tools.