The View Master Project Locations tool allows users to view the Asset, Address, and X/Y locations associated with Master Projects in ArcMap. Users can view either:
static, temporary layers made of Master Projects filtered at the time the tool is run; or
dynamic layers of Master Projects that are constantly updated.
Once the Master Projects' locations have been added to the map, the View Master Project Locations tool enables users to view and edit Master Projects. The tool plots any Master Project that has an Address, an X/Y coordinate or an assigned Asset.
Note: The Inventory feature classes do not need to be added to the map prior to using this tool.
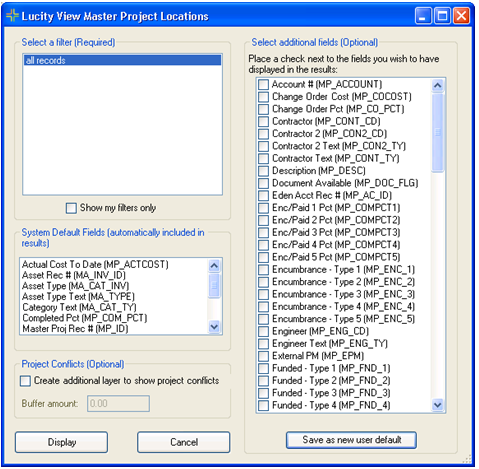
Master Project Locations
Select a Filter
Lists saved filters from the Master Projects module.
Show my filters only
Narrows the list of filters to display only those created by the current user.
System Default Fields
Lists fields from the Master Projects module that are automatically included in the temporary feature class created by this tool. These fields represent columns in the Attribute table.
Select Additional Fields
Enables the user to select additional fields from the Master Projects module to appear in the tool's results.
Save as new user default
Saves the user's selections in the Select Additional Fields section as their default selections when using this tool.
Project Conflicts -Create additional layer to show project conflicts
When enabled, creates several map layers to pinpoint where overlaps exists between work associated to one or more Master Projects.
Enter a Buffer Amount to direct the tool to identify work that is close together, rather than identical.
For example, one or more Master Projects might include work on traffic lights, sidewalks, and the road. Normally, the tool wouldn't see those as conflicts because they are all separate features that are in different locations, even though they are in close proximity. By adding a buffer, the tool may identify such work as conflicts, allowing project managers to focus their efforts on how the work is scheduled in that location.
Click the button in the toolbar. The following pop-up appears:
Select Master Projects.
Click OK. The associated tool appears.
OR
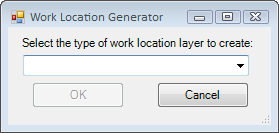
Click on the View Master Project Locations tool. The following pop-up appears:
Note: This option will not work if there is already a Master Project layer in the map.
Select Master Projects in the drop-down.
Click OK. The associated tool appears, which enables users to filter the master projects.
Select a filter. This step is required because it limits the type--and therefore, the amount--of master projects displayed.
Check the Show my Filters only option to limit the filters to those created by the current user.
The System Default list shows which fields are automatically included in the results. In the right-hand column, choose any additional fields you wish to display.
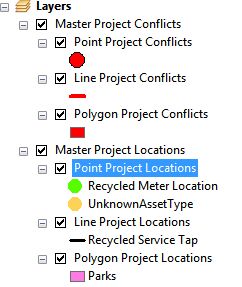
Check the Project Conflicts box to direct the tool to add group layers showing project conflicts to the results. (A conflict is any location where projects overlap.)
Select Display. New layers appear in the map.
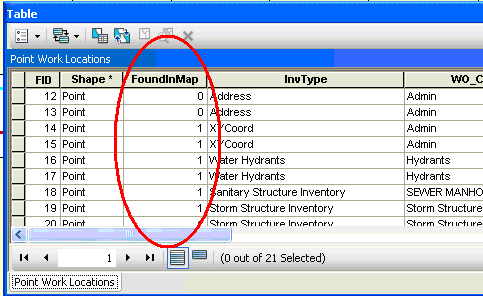
The tool attempts to map all locations for all Master Projects that meet the selected criteria. Features that the system is unable to represent spatially still exist in the layer; however, in the feature class's Attribute table, these items have a value of 0 in the FoundInMap field.
After Master Projects have been plotted in the Lucity Webmap, click on the View Master Project Locations tool .
Right-click on a Master Project location. A menu appears with three options:
View Work Master Project(s)
Edit Work Master Project(s)
View Work Master Project Report
Select the desired option.
View Work Master Projects: Opens the selected Master Project(s) in Lucity Desktop's View mode.
Edit Work Master Project(s): Opens the selected Master Project(s) in an editable grid within ArcMap. All required fields are added to the grid by default (that is, fields required by Lucity Desktop and those users set as required).
View Work Master Project Report: Opens the Master Project Report (provided by Lucity as a default report). The tool takes a snapshot of the current ArcMap display and saves it as a .jpg file, which is used by the Master Project Report.
A submenu appears listing the Master Projects located within the search tolerance of the mouse-click. Select the the Master Project upon which to perform the chosen function.
Note: To perform an action on multiple Master Projects, use the ESRI selection tool to select the Master Projects before clicking the View Work Locations tool. Then, right-click. The For all selected Master Projects option appears in the submenu.
Master Project Locations Live
Select a Filter Option
Gives users options for identifying a set of Master Projects to display.
Select an existing filter
Allows users to select a filter that was previously created and saved in the Master Projects module.
Specify advanced filter
Allows users to manually enter a filter using SQL.
No filter (load all records)
Displays all Master Projects that have spatial information.
Search Criteria
Enable users to select or add a filter, depending on their previous selection.
Select a Filter
Displays all filters that were previously created and saved in the Master Project module. Check the My Filters Only box to show only the filters created by the current user.
Manually enter WHERE clause
Enables the user to type in a filter for the Master Project module using SQL. (The statement should start with WHERE. ...)
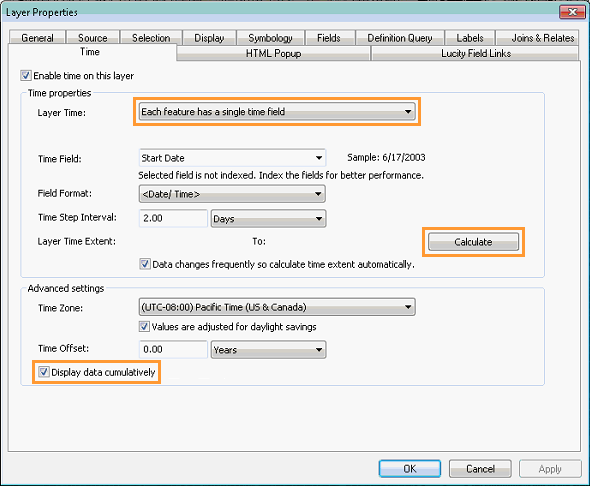
Time Options
Allow users to incorporate the ESRI time functions available within ArcMap into the Lucity Live Master Project layer.
Enable Time on Layers
Enables the ESRI time function for the Master Project layers.
Start Time Field
End Time Field
Indicates the preconfigured table fields that the time functions will use.
Time Step Interval
Enables the user to designate the number of days/weeks/months into which the time functions should group the Master Projects.
Note: This value can be changed in the layer properties after the layer is created.
Misc Options
Allow users to control the results in several other ways.
Do not plot addresses for records with assets...
Prevents the system from plotting the Address of the Master Project if there is an associated Asset. When the option is disabled, the system plots both the Address and the Asset.
Do not plot addresses for records with X/Y coordinates
Prevents the system from plotting the Address of the Master Project if an X/Y coordinate set. When the option is disabled, the system plots both the Address and the X/Y coordinate.
Select which fields should be included in the resulting layer(s)
When the tool plots the Master Project locations it displays associated Master Project information in the Attribute table. Check this box to open a new section of the tool. In this section of the tool you can modify which data from each Master Project record is displayed in the Attribute table.
Alias name for layer
Indicates the name for the layer that will be displayed in the map's table of contents.
Layer description
Indicates the description that will appear in the layer's properties.
Click the button in the toolbar. The following pop-up appears:
OR
Click on the View Master Project Locations tool . The following pop-up appears:
Note: This option will not work if there is already a Master Projects or Master Projects Live layer in the map.
Select Master Projects (Live).
Click OK. The associated tool appears, which enables users to filter the Master Projects.
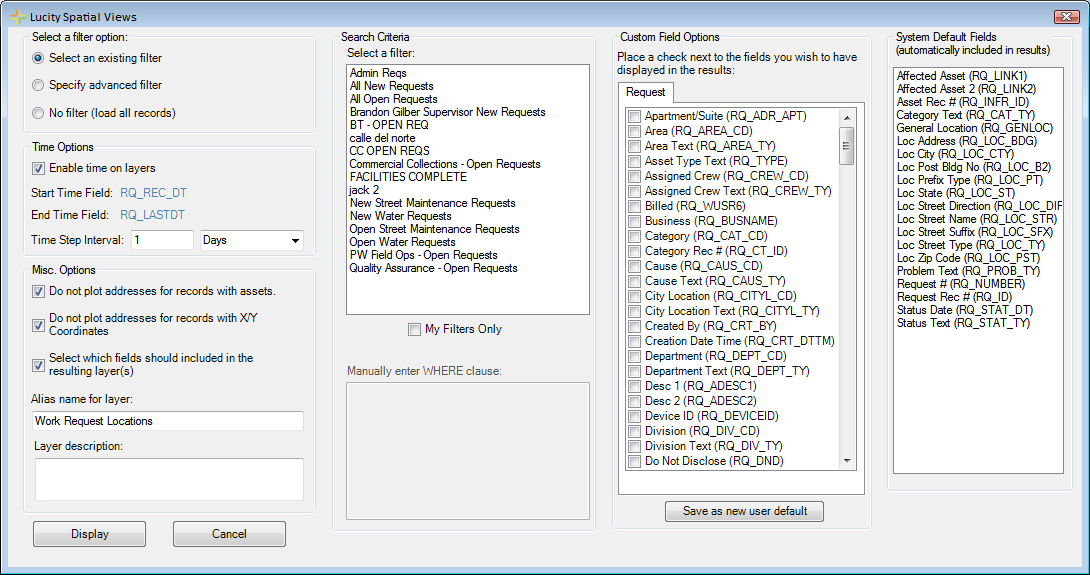
Choose a filtering option:
Select an existing filter - Enables the user to select a filter that was created and saved in the Master Project module.
Specify advanced filter - Enables the user to write a filter using SQL.
No filter (load all records) - Loads all Master Project records that contain spatial data.
Depending on the option chosen, the user should then:
Select a filter from the list. To display only those filters created by the current user, check the My Filters Only box.
Write a filter in the Manually enter WHERE clause field. (Start this statement with WHERE...)
Enable the time on the layers (if desired) and enter the Time Step Interval.
The following options are enabled by default:
Do not plot addresses for records with assets - When a Master Project contains an Asset and the Address, the tool plots only the asset. When disabled, the tool plots both.
Do not plot addresses for records with X/Y Coordinates - When a Master Project contains an Address and X/Y coordinates, the tool plots only the X/Y coordinates. When disabled, the tool plots both.
Certain fields are added to the results by default. Check the Select which fields should included in the resulting layer(s) option to customize the fields included in the results. The form expands to expose the following items:
Check the fields you wish to add to the results.
Default fields are shown in the list to the far right. Users cannot change this list, because these fields are required for the tool to function properly.
Users can save their custom fields by clicking the Save as new user default button. The setting is saved to the database, and these fields will be automatically checked the next time the user runs the tool.
After Master Projects have been plotted in the Lucity Webmap, click on the View Master Project Locations tool .
Right-click on a Master Project location. A menu appears with three options:
View Work Master Project(s)
Edit Work Master Project(s)
View Work Master Project Report
Select the desired option.
View Work Master Projects: Opens the selected Master Project(s) in Lucity Desktop's View mode.
Edit Work Master Project(s): Opens the selected Master Project(s) in an editable grid within ArcMap. All required fields are added to the grid by default (that is, fields required by Lucity Desktop and those users set as required).
View Work Master Project Report: Opens the Master Project Report (provided by Lucity as a default report). The tool takes a snapshot of the current ArcMap display and saves it as a .jpg file, which is used by the Master Project Report.
A submenu appears listing the Master Projects located within the search tolerance of the mouse-click. Select the the Master Project upon which to perform the chosen function.
Note: To perform an action on multiple Master Projects, use the ESRI selection tool to select the Master Projects before clicking the View Work Locations tool. Then, right-click. The For all selected Master Projects option appears in the submenu.
 How to plot Master Project locations
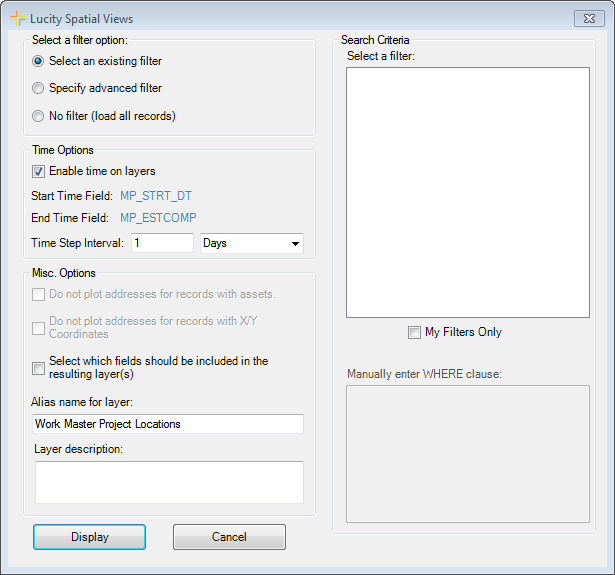
 . The following pop-up appears: