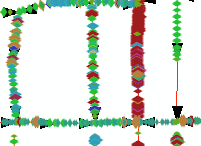
TV Observation data can be displayed in ArcMap using the View TV Observations tool. The tool finds all the most recent inspections for a set of pipes and creates a shapefile of all the observations from those inspections. Each point displays the Type, Severity and Location of the observation. Each observation also includes a hyperlink to related images. The hyperlinked information can be accessed with the ESRI hyperlink tool.
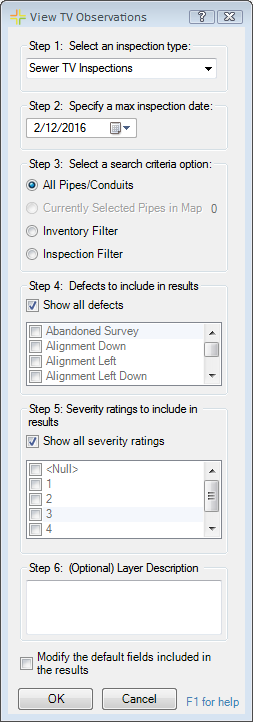
Step 1: Select an inspection type |
Enables users to select the module in which the Inspection Observations are stored: Sewer, Storm, or TV/ PACP Inspections. |
Step 2: Select a max inspection date |
Displays the Observations for the most recent inspections for each Pipe based on the Inspection date. Select a Max Date to limit the date range of the inspections shown. For example, if a user selects 9/24/2010, the tool only display Observations for Inspections that occurred before 9/24/2010. |
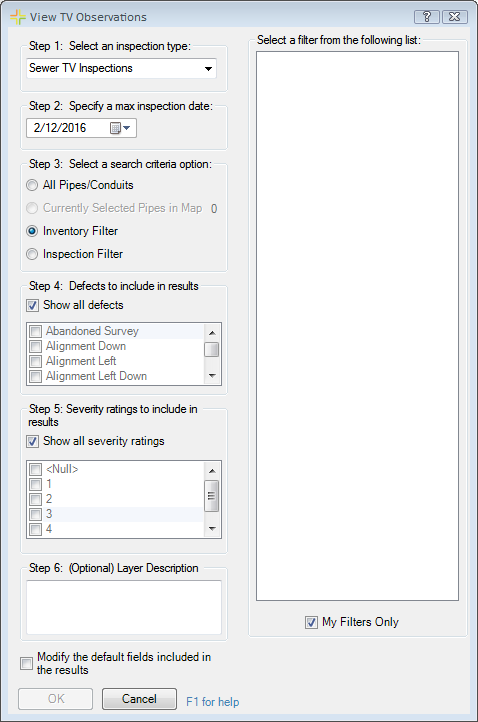
Step 3: Select a search criteria option |
Limits the number of Pipes the tool runs against. The tool can be run against:
|
Step 4: Defects to include in results |
Controls which Defects are displayed in the results. Users can display everything or they can disable the Show all defects option and choose which classes of Defect to show. |
Step 5: Severity ratings to include in results |
Allows you to filter observations based on severity ratings. |
Step 6: Layer Description |
Enables the user to provide an optional description that will appear in the Description field on the a layer Properties > General tab. |
Modify the default fields included in the results |
Enables users to change the fields shown in the output layer's Attribute table. |
OK |
Runs the tool with the selected settings. |
Cancel |
Closes the tool. |
How To View TV Observations
Note: There is a field in the temporary feature class that indicates whether any associated documents exist.