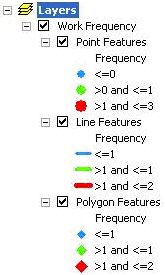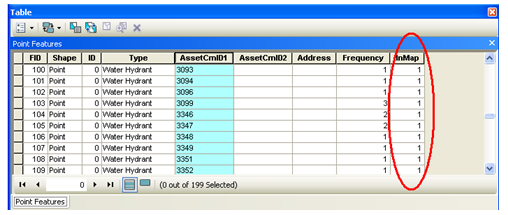
The View Work Frequency tool allows users to view how often the agency performs work in an area. The tool uses an Address, X/Y coordinate, or assigned Assets to plot Work Order locations within the map. Then, the tool groups the points together based on proximity. Layer symbology changes based on the number of Work Orders are at a given location.
Search Options |
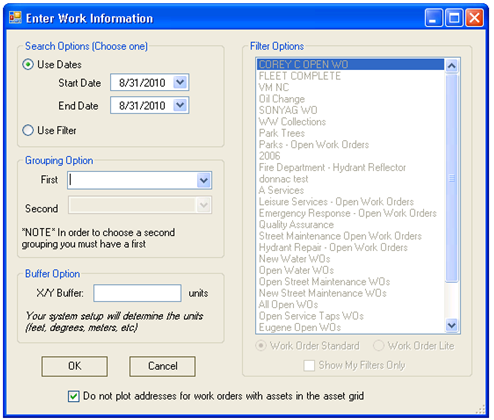
Enables the user to select a set of Work Orders to display based on a date range or a saved filter. |
Filter Options |
Enables the user to select a filter from the Work Order Standard or Work Order Lite modules when using the Use Filter option. The user can limit the list to only those filters he or she created. |
Grouping Option |
Enables users to group results based on the values of one or two fields. Example: If there are five Work Orders at one location, the tool normally displays one dot that is symbolized to represent the five Work Orders. However, if work orders are grouped by Task, and the five Work Orders at the location represent three different Tasks, the tool displays three dots. |
X/Y Buffer |
Directs the tool to group Work Orders that are within a specified distance of each other. Work Orders are typically grouped only when they represent the exact same location. To provide a more generalized map, the user can tell the tool to group work orders that are within a given distance of each other. Example: There are two Work Orders at Location A and four Work Orders at Location B, which is 10 feet away. The program normally puts a point at Location A that is symbolized to represent two Work Orders and a point at Location B that is symbolized to represent four Work Orders. However, if the user enters an X/Y Buffer of 11, the program reacts differently. After identifying the two Work Orders at Location A, it searches 11 feet* in all directions for other Work Orders. When it discovers the four Work Orders at Location B, it displays a point between the two locations that is symbolized to represent all six Work Orders. *The unit of measure is based on the scale the map project uses. |
Do not plot addresses for ... |
Controls how a Work Order is plotted in the results. If a Work Order has an Address and Assets, the system automatically plots both the Address and Asset point in the map. However, when this option is enabled, the system only plots the Asset points when they are present. |
How To Plot Work Frequency